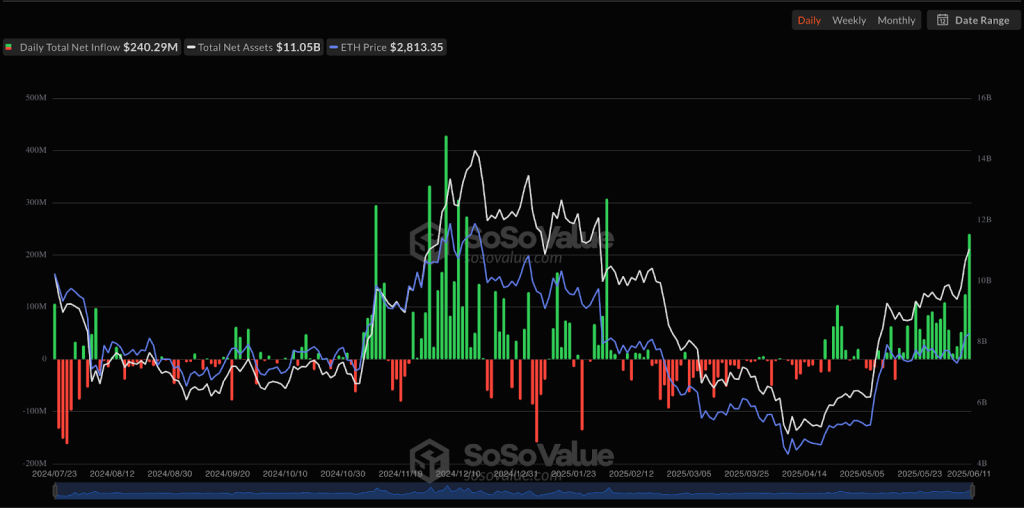
Exchange-traded funds (ETFs) tied to Ethereum have significantly outperformed those linked to Bitcoin, recording a substantial $240.29 million in daily net inflows on Wednesday. This figure surpasses the $164.57 million seen in Bitcoin ETFs, marking the 18th day in a row of positive inflows into Ethereum’s spot ETFs.
Total Ethereum Spot ETF Net Inflow Source: SoSoValue
This increase marks the highest daily inflows for Ethereum ETFs in the past four months, coinciding with Ethereum’s rise above the $2,800 mark for the first time since February, achieving a 12-day peak.
The surge in interest began in early June, when Ethereum staking hit a record high of 34.65 million ETH locked on the Beacon Chain, accounting for nearly 29% of the total circulating supply. This development reflects a strong long-term commitment from holders who opted to stake their assets instead of selling.
Institutional Capital Rotation Drives Ethereum Momentum
Data from SoSoValue highlights that BlackRock’s iShares Ethereum Trust (ETHA) led the inflows on Wednesday, drawing in $163.6 million. The fund has maintained a 23-day streak of inflow positivity, currently managing over 1.55 million ETH valued at approximately $4.23 billion.
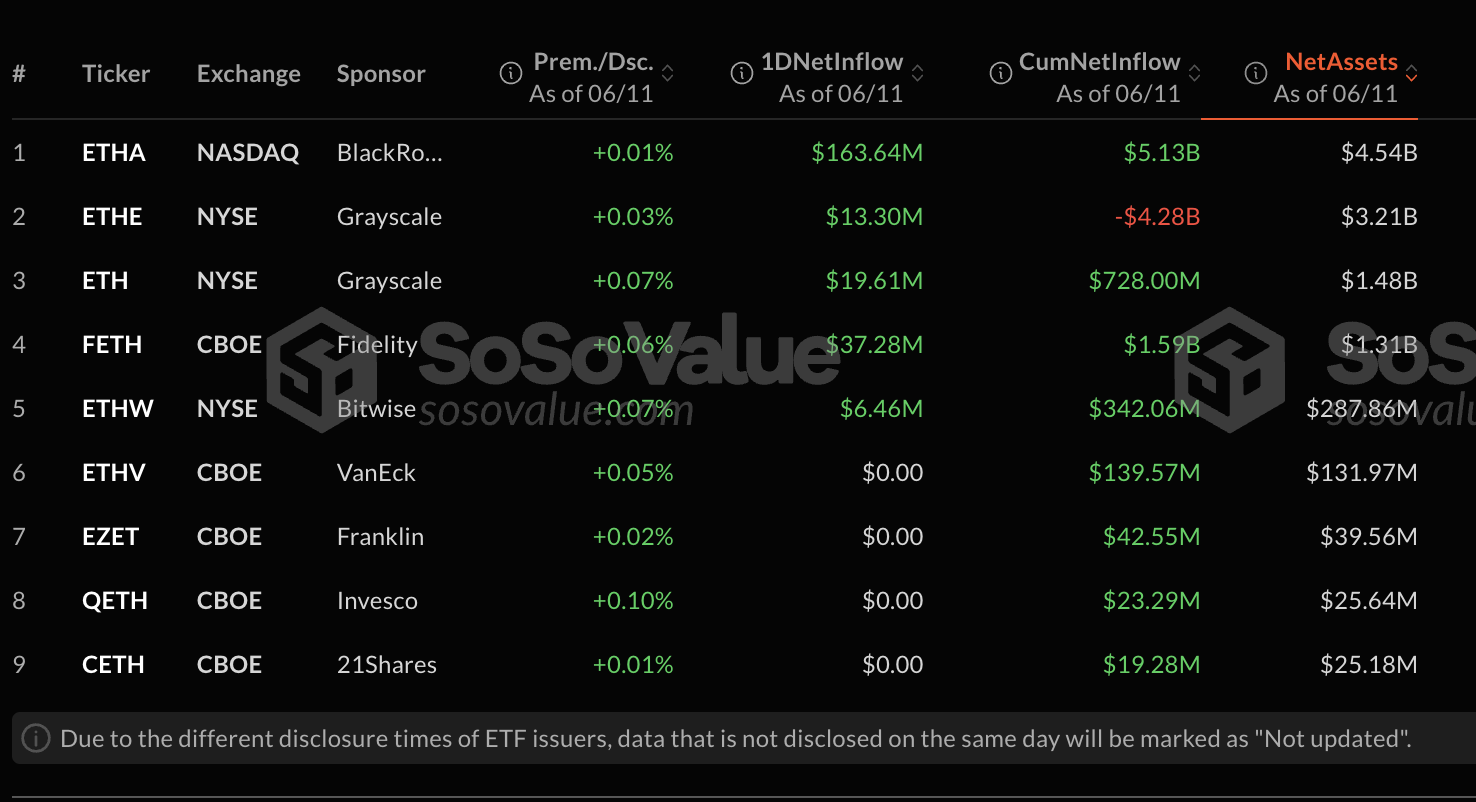
Market Data Source: SoSoValue
Since its inception in July 2024, cumulative inflows into Ethereum ETFs have reached $3.74 billion, with the fund’s stock price experiencing over a 50% increase since the year’s beginning. Noteworthy regulatory shifts from the new administration have bolstered confidence in Ethereum’s ecosystem, coinciding with the network’s recent Pectra upgrade that addressed persistent scalability and cost-efficiency issues obstructing developer engagement.
Ethereum co-founder Vitalik Buterin recently discussed at ETHGlobal his expectation that the network’s transaction processing capability will enhance tenfold over the next year, thanks to layer-1 scaling solutions.
This upsurge in Ethereum ETF inflows has led many investors to reassess ETH’s value, viewing it as undervalued compared to Bitcoin’s recent historical peaks and the broader altcoin rally from the previous year.
Technical Breakout Patterns Point Toward $3,000 Target
An analysis of Ethereum’s price movements reveals intriguing technical patterns across various timeframes.
For instance, the weekly Elliott Wave analysis identifies a comprehensive five-wave impulse pattern originating from 2022’s lows. The pivotal moment came when Ethereum broke above a significant descending trendline that had restrained price movements since the 2021 all-time highs.
This structural break signals the conclusion of a prolonged accumulation phase, characterized by a High-Volume Flag pattern throughout 2023, where savvy investors accumulated positions while retail sentiment remained pessimistic.
On the daily chart, an inverse head-and-shoulders pattern indicates a completed formation, with Ethereum currently priced at $2,772. The asset has shown robust upward momentum after decisively breaching the red descending trendline that previously functioned as resistance.
Projections based on this pattern suggest near-term targets around $3,300, with a more ambitious objective approaching $4,000. The step-like structure implies potential consolidation periods at critical resistance levels before further advances.
Perhaps most compelling is the comparative analysis, suggesting that Ethereum is mirroring Bitcoin’s trajectory from 2018 to 2021. Both assets display similar patterns of extended bear markets followed by base formation around their respective 1-week moving averages.
The current Ethereum pattern parallels Bitcoin’s path from the COVID crash to an explosive recovery, positioning ETH similarly to Bitcoin in early 2020.
If this historical trend continues, Elliott Wave projections indicate potential price targets reaching $5,917 and even $13,822, representing a substantial increase from present levels.
Short-term technical indicators present a mixed, yet generally favorable outlook as Ethereum trades at $2,771 after a brief break above the critical $2,800 resistance level, which has limited price action since early May.
However, a recent high of $2,834 resulted in a rejection, suggesting Ethereum may enter a short-term retest phase, with the $2,750-$2,800 zone now serving as immediate resistance.
The MACD indicator remains in bullish territory but is showing a flattening trend, indicating a possible near-term consolidation phase. Key support levels to watch include the $2,680 zone, which corresponds to the 50% Fibonacci retracement, with additional support at $2,620 and $2,550.
To facilitate a bullish scenario, Ethereum must break decisively above the $2,880 resistance, prompting the next significant move towards $3,000 and beyond. Should the comparison to Bitcoin hold true, the ultimate cycle targets could extend well into the five-figure range.
The post Ethereum ETFs Smoke Bitcoin ETFs with Massive $240M Inflows – $3K Breakout Next? appeared first on Finance Newso.


